Epidemiology
| Site: | letslearn.gnomio.com |
| Course: | Community Medicine UG |
| Book: | Epidemiology |
| Printed by: | Guest user |
| Date: | Friday, 22 May 2026, 7:46 PM |
1. 1. Following is the graphical representation of incidence rates per 1 lakh population of colorectal cancer in various age-groups from 2016 to 2020
a. What is the below graphical representation known as?

b. What type of data is depicted using the above graph?
c. Interpret the graph provided.
a. Line diagram.
b. Quantitative data
c. Colorectal cancer incidence is found to be increasing from 2012 to 2016 in all age groups. Highest incidence is noted in the age group > 60 years.
1. 2. a. This below graph is called as …………….
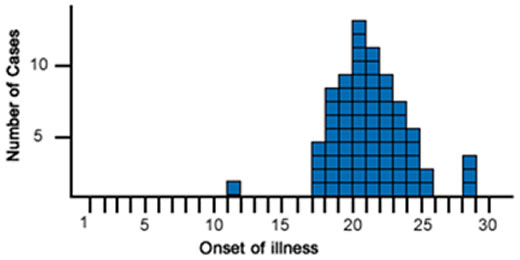
b. Cutoff for distinguishing endemic from an epidemic frequency is
c. What are the three types of surveillance conducted in IDSP?
d. List any four diseases which are included in the IDSP surveillance.
a. Epidemic curve
b. +2SE from endemic frequency
c. Syndromic surveillance, Presumptive surveillance, Confirmed case surveillance
d. Polio, Malaria, JE, Dengue, Measles, TB, Cholera, Plague