OSPE
-
Following is the graphical representation of incidence rates per 1 lakh population of colorectal cancer in various age-groups from 2016 to 2020
-
What is the below graphical representation known as?
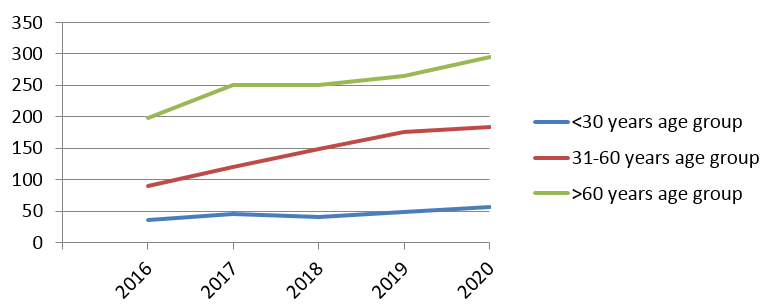
b. What type of data is depicted using the above graph?
c. Interpret the graph provided.